Chindam Suresh*, Kondapuram Parameshwar, Kosika Sandeep
Department of Pharmaceutics, School of Pharmacy, Gurunanak Institute of Technical Campus, Hyderabad, Telangana, India.
*Address for corresponding Author
Chindam Suresh
Assistant Professor
School of Pharmacy, Guru Nanak Institutions Technical Campus, Hyderabad, Telangana, India
Abstract
Objective: Design and development of okra gum based colon specific tablet formulations for chronotherapeutic delivery of drugs, Eterocoxib for the treatment of diseases. Materials and methods: The gum extracted from thoroughly washed, sliced and crushed fruits with a laboratory blender. After extraction the precipitate of the gum were dried in hot air oven for about 20min at 50C and then precipitates were kept in a dessicator for further drying Etoricoxib, HPMC, E.C other formulation excipients. The in vitro dissolution test has been performed in 0.1 N HCl for first two hours and the rest in 6.8 pH phosphate buffer using USP apparatus type II (paddle), at 50 rpm for six hours. The spectrum was measured in the solid state as Potassium bromide dispersion..The Press coated tablets were prepared by varying polymer (HPMC): polymer (E.C) ratio i.e., 4:0, 3:1, 2:2, 1:3, 3:1 and 0:4. Results and conclusion: The drug release from the dosage forms was started after 4hrs lag time.The Press coated tablets obtained by 3:1 ratio (P2F9) shows good lag time, more % drug released immediately after lag time in comparision with those prepared by 4:0, 2:2, 3:1, 0:4 hence P2F9. It has been concluded from the above investigation that Press coated dosage form of Etoricoxib could delay the release up to 4hrs and further exhibited immediate release of the drug and shows 20 hr action. The results obtained in this research work clearly indicated a promising potential of colon specific drug delivery of eterocoxib by using okra gum containing HPMC, HPMS EC, as a rate controlling polymer for the effective treatment of rheumatoid patients.
Keywords: HPMC, HPMC, E.C, Okra Gum, colon specific drug delivery
Introduction
Oral drug delivery system is the most commonly used route for drug delivery due to its ease of administration, better patient compliance, and flexibility in design and development of formulation. The drug delivery to the colon has attracted a lot of attention of the scientist working on oral drug delivery system which is mainly due to the fact that colon is a site where both local and systemic drug delivery can take place (Bussemer et al., 2001). In recent times the colon-specific drug delivery systems are also gaining importance for the systemic delivery of proteins and peptide drugs. Due to negligible activity of brush border membrane peptidase activity and less activity of pancreatic enzymes, the colon is considered to be more suitable for delivery of protein and peptide in comparison to small intestine Besides this low hostile environment, the colonic transit time is long (20-30 h) and the colonic tissue is highly responsive to the action of absorption enhancers The longer residence time, less peptidase activity, natural absorptive characteristics and high response to absorption enhancers make colon a promising site for the delivery of protein and peptides, oral vaccines, insulin, growth hormone, erythropoietin, interferons and interleukines.
Colonic delivery can be accomplished by oral or rectal administration. Rectal dosage forms such as suppositories and enemas are not always effective since a high variability in the distribution of these forms is observed and enema solutions can only offer topical treatment to the sigmoid and descending colon. Therefore, oral administration is preferred, but for this purpose, many physiological barriers have to be overcome. Absorption or degradation of the active ingredient in the upper part of the GIT is the major obstacle and must be circumvented for successful colonic drug Delivery.

Figure 1. Anatomy of human gastrointestinal tract (Friend and Tozer, 1992).
Table 1. Anatomical and physiological features of small intestine and colon
|
Region of gastrointestinal tract |
Length (cm) |
|
Entire gastrointestinal tract |
500-700 |
|
Small intestine |
|
|
Duodenum Jejunum Heum |
20-30 150-200 200-350 |
|
Large intestine |
|
|
Caecum Ascending colon Transverse Colon Descending colon Sigmoid colon Rectum Anal canal |
6-7 20 45 30 40 12 3 |
Materials and methods
Isolation of Okra Gum
Unripe and tender fruits of Okra were purchased from a local market. A 3kg weight of fruits were thoroughly washed, sliced and crushed with a laboratory blender (Jyoti Pvt Ltd. Vadodara). The obtained paste was macerated in distilled water for 24h in the presence of 0.1% wt/vol sodium metabisulphite (an antioxidant). Expression was done with a clean muslin cloth by placing a little quantity of the paste in the cloth and then expressed so that the gum exuded from it. Precipitation of the extract was done with acetone, by adding a little quantity of the extract in a beaker containing 20mL of acetone and the mixture was stirred using glass rod for about 3min. The precipitated gum was transferred into another beaker containing fresh acetone and stirred continuously (30min) until the gum was completely precipitated. The precipitates were dried in hot air oven for about 20min at 50°C and then precipitates were kept in a dessicator for further drying. Drying continued until constant weight was obtained.
Phytochemical Examination
Following chemical tests were conducted to evaluate the phytochemical nature of obtained OG (Table 2). These were Ruthenium red test, Molisch test, Ninhydrin test and test for reducing sugars.
Table 2. Chemical tests for phytochemical examination of gum
|
Tests |
Reagents |
Composition |
Test for presence of |
Positive test |
|
Ruthenium red test |
Ruthenium red |
- |
Mucilage |
Red color |
|
Molish test |
Molish’s reagent |
A solution of napthol in 95% ethanol |
Carbohydrate |
Purple ring at the interface between the acid and test layers |
|
Ninhydrin test |
Ninhydrin reagent |
2,2-Dihydroxyindane-1,-dione |
Ammonia or primary and secondary amines |
Blue to blue violet color |
|
Test for reducing sugars |
Fehling I |
7g Of Hydrated Copper (Ii) Sulfate Dissolved In 100 Ml Of Dist.Water |
Reducing Sugar |
Brick red precipitate. |
|
- |
Fehling II |
35 g of potassium sodium tartrate and 10 g of sodium hydroxide in 100 ml of dist.water |
Reducing Sugar |
- |
Swelling index
One gram sample was placed in 25mL graduated plastic centrifuge tubes and the volume occupied was noted. 10mL of distilled water was added and the content was allowed to swell for 1h with the vigorous shaking at the time interval of 10min. Mixture was allowed to stand for 10min followed by centrifugation at 1000rpm for 10min on a bench centrifuge. The supernatant was carefully decanted and volume of sediment was measured. The swelling index was computed using following equation (Bapat S 2004).
S= V2/V1 --------------(1)
Where S= Swelling index
V1= Volume occupied by the gum prior to hydration
V2= Volume occupied by the gum after hydration
Swelling index was determined for three times for the same sample of OG by keeping the conditions constant.
Loss on drying
The adopted method is specified in the British Pharmacopoeia 2007 for acacia.Same procedure was used to determine loss on drying for Og. According to which petridish was dried under the condition prescribed for the substance to be examined. One gram of sample was transferred into dried petridish which was then dried in an oven at 105°C until the weight of content became constant. The moisture content was determined as the ratio of weight of moisture loss to weight of sample expressed as a percentage. Loss on drying was determined for three times for the same sample of OG by keeping the conditions constant.
Total ash and acid insoluble ash determination
Ash content was estimated by the measurement of residue left after combustion of two grams (W) of gum in a tared crucible in a furnace at temperature not exceeding 450°C to get carbon free residue which was cooled and weighed (W2).
The obtained ash was boiled with 25mL of 2M hydrochloric acid solution for 5min. The content was filtered. After filtration, the insoluble matter was washed with hot water and resultant product was ignited. After ignition, residues were obtained. The weight of residues (W3) was determined and percent acid insoluble ash was alculated. The total ash and acid insoluble ash were determined for three times for the same sample of OG by keeping the conditions constant.
The percentage of total ash of the sample was calculated by given equation [2]:
(W2/W1) x 100--------------(2)
The percentage of acid insoluble ash of the sample was calculated by given equation (3):
(W3/W1) x 100--------------(3)
Analytical method for the estimation of Etoricoxib
Determination of λ max for Etoricoxib (Mukherjee and Desiraju, 2012)
On the basis of preliminary identification test, it was concluded that the drug complied the preliminary identification. From the scanning of drug, it was concluded that the drug had λ max of 234.5 nm which was nearer to 234 nm as reported.
Preparation of standard calibration curve of Etoricoxib
The standard calibration curve for Etoricoxib was prepared using pH 6.8 phoshate buffer solution.
Standard solution: The 25 mg of Etoricoxib was dissolved in 25 ml pH 6.8 phosphate buffer solution to give a concentration of 1 mg/ ml (1000 µg/ml).
Stock solution: From standard solution take 5 ml of solution in 50 ml of pH 6.8 phosphate buffersolution to produce the 50 µg/ml concentration and take from the 50 µg/mlof the solutionaliquots of 1, 2, 3, 4, and 5 ml of stock solution was pipette out in 10ml volumetric flask.The volume was made up to mark with 6.8 buffer solution to produce concentration as 2, 4, 6, 8, and 10 µg/ml of Etoriccoxib respectively.
The absorbance of prepared solution of Etoriccoxib was measured at 234 nm in Shimadzu UV/visible 1700 spectrophotometer against pH 6.8 phosphate buffer solution as blank. The absorbance data for standard calibration curve are given in Table 4 and plotted graphically as shown in the Figure 4. The standard calibration curve yields a straight line, which shows that drug obeys Beer’s law in the concentration range of 2 to 10 µg/ml.
Formulation of core tablets
Table 3. Composition of different core tablet formulations
|
Ingredients (mg) |
F 1 |
F 2 |
F 3 |
F 4 |
F 5 |
F 6 |
F7 |
F8 |
F9 |
F10 |
|
Etoricoxib |
50 |
50 |
50 |
50 |
50 |
50 |
50 |
50 |
50 |
50 |
|
Lactose Monohydrate |
150.2 |
145.8 |
140.3 |
150.2 |
145.8 |
140.3 |
150.2 |
145.8 |
140.3 |
156.8 |
|
Talc |
4.4 |
4.4 |
4.4 |
4.4 |
4.4 |
4.4 |
4.4 |
4.4 |
4.4 |
4.4 |
|
Magnesium stearate |
4.4 |
4.4 |
4.4 |
4.4 |
4.4 |
4.4 |
4.4 |
4.4 |
4.4 |
4.4 |
|
PVP |
4.4 |
4.4 |
4.4 |
4.4 |
4.4 |
4.4 |
4.4 |
4.4 |
4.4 |
4.4 |
|
SSG |
6.6 |
11 |
16.5 |
- |
- |
- |
- |
- |
- |
- |
|
CCS |
- |
- |
- |
6.6 |
11 |
16.5 |
- |
- |
- |
- |
|
CP |
- |
- |
- |
- |
- |
- |
6.6 |
11 |
16.5 |
- |
|
Total Weight |
220 |
220 |
220 |
220 |
220 |
220 |
220 |
220 |
220 |
220 |
Formulation of core tablets by wet compression method
The inner core tablets were prepared by using direct compression method.As Shown in table 4 powder mixtures of etoricoxib, pvp,talc, crospovidone, lactulose monohydrate ingredients were dry blended for 20 min followed by addition of MgStearate. The mixtures were then further blended for 10 min., 200mg of resultant powder blend was manually compressed using KBr hydraulic press at a pressure of 1 ton, with a 8mm punch and die to obtain the core tablet.
Table 4. Formulation of coating polymer for Press coat method
|
Press coat |
F11 |
F12 |
F13 |
F14 |
F15 |
|
HPMC |
400mg |
300mg |
200mg |
100mg |
0mg |
|
Okra Gum |
0mg |
100mg |
200mg |
300mg |
400mg |
|
Total wt |
400mg |
400mg |
400mg |
400mg |
400mg |
Formulation of mixed blend for barrier layer
The various formulation compositions were containing Okra Gum and HPMC. Different compositions were weighed dry blended at about 10 min and used as Press - coating material to prepare press - coated pulsatile tablets respectively by direct compression method.
Preparation of press-coated tablets
The core tablets were press-coated with 400mg of mixed blend/granules as givenin Table 6. 200mg of barrier layer material was weighed and transferred into a 13 mm die then the core tablet was placed manually at the center. The remaining 200mg of the barrier layer materiel was added into the die and compressed at a pressure of 5tons for 3min using KBr hydraulic press.
Evaluation of rapid release core (RRCT) and press-coated tablets Of Etoricoxib
Sieve Analysis
The procedure involves the Electromagnetic Sieve shaking of the sample through the series of successively arranged sieves (sieve no. - 20, 30, 40, 60, 80, and receiver), and weighing of the portion of the sample retained on each sieve and calculate percentage retained on each sieve.
Flow properties
Angle of Repose (θ)
These are the simple and related techniques for measuring the resistance to particle moment. Angle of repose is defined as the maximum angle possible between the surface of a pile of powder and horizontal plane,
Tan θ = h/r
θ = tan-1 h/r
Where h =height of pile
r =radius of base of pile
θ =angle of repose
Method: A glass funnel is held in place with a clamp on a ring support over a tile Approximately 100gms of powder is transferred into funnel through a mesh size number 20 keeping the orifice of the funnel blocked by the thumb.
When the powder is emptied from the funnel, the angle of the heap to the horizontal plane is measured with a scale. The height of the pile (h) and the radius at the base is measured with a ruler. The angle of repose is thus estimated
Angle of repose limits are mentioned in the table 5
Table 5. Relationship between angle of repose (θ) and powder flow
|
Angle of repose (θ) degrees |
Flow |
|
<25 |
Excellent |
|
25-30 |
Good |
|
30-40 |
Passable |
|
>40 |
Very poor |
Compressibility index
It is the propensity of a powder to be compressed. It is measured by tapped density apparatus for 500, 750 and 1250 taps for which the difference should be not more than 2 %. Based on the apparent bulk density and tapped density the percentage compressibility of the blend was determined using the following formula.

Table 6. Acceptance limits for Consolidation index
|
Consolidation index |
Flow |
|
5-15 |
Excellent |
|
12-16 |
Good |
|
18-21 |
Fair to passable |
|
23-35 |
Poor |
|
33-38 |
Very poor |
|
>40 |
Very very poor |
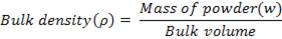
Hausner’s ratio
It indicates the flow properties of the powder. The ratio of tapped density to the bulk density of the powder is called Hausner ratio.
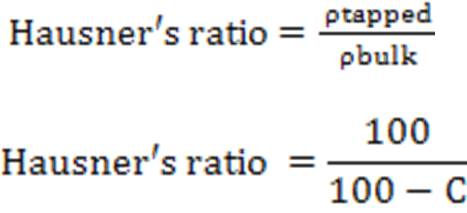
Bulk Density
Bulk density of a compound varies substantially with the method of crystallization, milling or formulation. Bulk density is of great importance when considers the size of high dose capsule product or homogenicity of allow dose formulation in which these are large differences in drug and excipient densities Bulk density is determined by graduated cylinder containing a known mass of powder whose initial volume is noted. Cylinder is fixed on the mechanical tapper apparatus. Then the final volume is noted, and this bulk volume. Then bulk density is calculated is using
Weight variation
Twenty tablets were randomly selected from each batch weighed individually. The average weight and standard deviation was calculated .
Thickness
Three tablets from each batch of formulation were collected and the thicknesses of the tablets were measured with the help of Verniercaliper. The average thickness was calculated.
Hardness
Hardness was measured using Monsanto tablet hardness tester. The hardness of five tablets in each batch was measured and the average hardness was calculated in terms of kg/cm2.
Friability (F)
Friability of the tablet determined using Roche friabilator. Pre-weighted sample of tablets were placed in the friabilator and were subjected to the 100 revolutions. Tablets were dusted using a soft muslin cloth and reweighed.
Wetting time
Wetting time of dosage form is related to the contact angle. A piece of tissue paper folded twice was placed in a small petridish containing 6 ml of water. Tablet was kept on the paper and the time for complete wetting was measured. The mean ± SD values were calculated accordingly.
Drug content
For determination of drug content at least five tablets from each formulation were weighed individually, crushed and diluted to 100 ml with sufficient amount of phosphate buffer of pH 6.8 in a volumetric flask. Then aliquot of the filtrate was diluted suitably and analyzedspectrophotometrically at 234 nm against blank. Drug content was calculated using standard curve.
Disintegration time for RRCTs
To test the disintegration time of tablets, one tablet was placed in each tube and the basket rack was positioned in a 1 liter beaker containing phosphate buffer pH 6.8 at 37°C ± 1°C such that the tablet remains 2.5 cm below the surface of the liquid. The time taken for the complete disintegration of the tablets was noted.
In-vitro release studies for RRCTs
Tablet was introduced into the basket of the LABINDIA TS 8000 USP dissolution test apparatus and the apparatus was set in motion at 50 rpm for time period of 1hrs, 5 ml of sample was withdrawn for every 5min intervals and replaced by pH 6.8 phosphate buffer solutions. Samples withdrawn were analyzed by UV spectrophotometer for presence of drug using buffer solution as blank.
In-vitro Dissolution methods for press-coated tablets
In vitro Dissolution studies of Pulsatile delivery systems was done with the conventional paddle method of press coated tablets were performed at 37 ± 0.5 °C using 0.1%hcl for 2hrs followed by 6.8 buffer in USP II paddle method at 50 rpm. 5 ml of filtered aliquot was manually withdrawn at pre-determined time intervals and replaced with 5 ml of fresh 6.8 buffer solution maintained at the same temperature. The samples were analysed at 234nm using a UV spectrophotometer. The lag time and percentage release was determined of the each formulation.
Stability Studies
The stability study of the formulations was carried out according to ICH guidelines at 40 ± 2 °C/75 ± 5 % RH for one month by storing the samples in stability chamber (Lab-care, Mumbai).
Compatibility Studies
FT-IR Spectra: The Infra-red studies were performed by the instrument Shimadzu Corporation japan. In this, enough samples are placed on the crystal area, and the pressure arm should be positioned over the sample area. Force is applied to the sample, pushing it onto the diamond surface. Later the sample is analysed. The same procedure is repeated for analysis of pure drug, excipients and mixture.
Results and discussion
Okra gum: Phytochemical examination
Table 7. Chemical tests for phytochemical examination of okra gum powder
|
Tests |
Observations |
Inference |
|
Ruthenium red test |
Red color |
Mucilage |
|
Molisch test |
Purple ring at the interface between the acid test layers |
Carbohydrate |
|
Ninhydrin test |
No Blue to blue violet color |
Absence of amino acid |
|
Test for reducing sugars |
|
|
|
Benedict’s reagent |
Blue to green/yellow orange/red/brown |
Reducing sugars |
|
Fehling I |
Brick red precipitate |
Reducing sugars |
|
Fehling II |
Brick red precipitate |
Reducing sugars |
Table 8. Physicochemical characterization
|
Parameters |
Okra gum |
|
|
Solubility |
Slightly soluble in water.Practically insoluble in ethanol, acetone and chloroform |
|
|
Swelling index |
pH1.2 |
2.25 ± 0.2 |
|
pH 7.4 |
2.38±0.3 |
|
|
pH 6.8 |
2.15±0.2 |
|
|
Distilled water |
2.22±0.5 |
|
|
Loss on drying |
0.89 ±0.01% |
|
|
Total ash |
1.8±0.03% |
|
|
Acid insoluble ash |
0.6 ±0.03% |
|
|
Angle of repose |
32±0.11̊ |
|
|
pH |
6.8±0.54 |
|
|
Bulk density |
0.72±0.021 g/cm3 |
|
|
Tapped density |
0.84±0.031 g/cm3 |
|
|
Compressibility index |
14.3 ±0.014% |
|
|
Hausner’s ratio |
1.16 ±0.014 |
|
Standard calibration curve of Etoricoxib
The standard calibration curve for Etoricoxib was prepared using pH 6.8 phoshate buffer solution. The absorbance of prepared solution of Etoricoxib was measured at 234 nm in Shimadzu UV/visible 1700 spectrophotometer against pH 6.8 phosphate buffer solution as blank. The drug showing linearity up to 10 µg/ml.
Table 9. Linearity values for Etoricoxib
|
S.No |
Concentration (µg/ml) |
Absorbance (nm) |
|
1. |
0 |
0 |
|
2. |
2 |
0.1406 |
|
3. |
4 |
0.2846 |
|
4. |
6 |
0.4346 |
|
5. |
8 |
0.6323 |
|
6. |
10 |
0.8131 |

Figure 2. Standard plot of Etoricoxib in pH 6.8 phosphate buffer
FTIR Studies Data
The spectrum was measured in the solid state as Potassium bromide dispersion. The bands were recorded using the FT-IR technique. FT-IR spectral study revealed that similar characteristic peaks appear with minor differences, for the puredrug and drug formulation, as shown in below figure. Hence it was confirmed that no chemical interaction had taken place between the drug and the polymer used.
Table 10. FTIR data
|
Functional groups |
Frequency of pure drug (cm-1) |
Frequency of formulation (cm-1) |
|
C-H Stretching vibrations of methyl and methylene groups |
3030.5-2860 |
3051.49-2789.16 |
|
C-H strecteching vibrations of the methoxy group |
2840 |
2843.17 |
|
C-O streteching vibrations of the aromatic ethers |
2236 |
2235.57 |
|
Skeletal stretching vibrations of the benzene ring |
1607,1518 |
1599,1518 |

Figure 3. FT – IR spectra of pure Etoricoxib
Evaluation of rapid release core (RRCT) and press-coated tablets Of Etoricoxib
The below table shows the pre-compressional parameters of power blend. There was change in angle of repose from F1 to F9. Angle of repose increased from 24.0 ± 0.02 to 32.0 ± 0.03 respectively.
Bulk Density and Tapped Density of all formulations are shown in the table No: The results indicated that both densities ranges from 0.58 ± 0.02 to 0.68 ± 0.04 gm/c.c and 0.65 ± 0.03 to 0.79 ± 0.02 gm/c.c respectively.)
% Compressibility ranges from 9.2 ± 0.04 to 26.58 ± 0.03 and Hausner’s Ratio 1.10 ± 0.04 to 1.36 ± 0.04 respectively. All the formulations showed good and Fair flow properties.
Table 11. Pre-compressional parameters of power blend (F1 to F6)
|
Parameters |
Formulation Code |
|||||
|
F1 |
F2 |
F3 |
F4 |
F5 |
F6 |
|
|
Angle of repose |
24.22 ±1.25 |
25.15±1.31 |
27.22 ±1.59 |
28.39 + 1.52 |
29.74 + 1.67 |
28.56 + 0.492 |
|
Bulk density (g/ml) |
0.238 ±0.008 |
0.242 +0.009 |
0.028 +0.009 |
0.236+ 0.007 |
0.237 ± 0.006 |
0.2150 + 0.005 |
|
Tapped density (g/ml) |
0.263+ 0.010 |
0.277 +0.018 |
0.259 ± 0.014 |
0.267+ 0.012 |
0.265 ± 0.011 |
0.2484 + 0.018 |
|
Compressibility Index (%) |
9.54 ±0.71 |
12.63±1.78 |
11.71 ± 1.56 |
11.20 + 1.23 |
10.56 + 0.78 |
13.46 + 0.45 |
|
Hausner’s Ratio |
1.21±0.01 |
1.19±0.01 |
1.23±0.02 |
1.22±0.01 |
1.17±0.02 |
1.18±0.01 |
Table 12. Pre-compressional parameters of power blend (F7 to F10)
|
Parameters |
Formulation Code |
|||
|
F7 |
F8 |
F9 |
F10 |
|
|
Angle of repose |
21.20 ±0.261 |
22.44 ±0.380 |
26.76 ±0.311 |
26.42 ±0.144 |
|
Bulk density (g/ml) |
0.46±0.02 |
0.45±0.02 |
0.49±0.00 |
0.44±0.01 |
|
Tapped density (g/ml) |
0.43±0.02 |
0.43±0.04 |
0.43±0.01 |
0.41±0.01 |
|
Compressibility index (%) |
16.04 ± 0.78 |
12.00 ± 0.70 |
314.29 ± 1.24 |
16.83 ±0.64 |
|
Hausner’s ratio |
1.23±0.01 |
1.22±0.01 |
1.18±0.01 |
1.21±0.01 |
Post Compressional Parameters
Hardness: Table No shows hardness of all tablet formulations. hardness of all formulations was in between 3.5 to 5.5 kg/cm2
Percent Friability: Table shows the friability values of all tablet formulations. The results indicated that the % friability of formulation was between 0.7% and 0.1% which is considered to be acceptable for withstanding normal shipping and handling.
Thickness: Table shows the thickness of all tablet formulations. The results indicated that the thickness of all formulations was between 3 – 3.7 mm. Thickness of all the tablets are almost same.
Weight variation test: Table shows the % weight variation of all table formulations. The results indicated that average % weight variation of all tablets formulations was around 7%.
Disintegration Time: All the formulations showed disintegration time in the range of 2 min 40sec to 3 min 40 sec.
Table 13. Friability values of all tablet formulations
|
Physical parameter |
F 1 |
F 2 |
F 3 |
F 4 |
F 5 |
F 6 |
F 7 |
F 8 |
F 9 |
F 10 |
|
Weight variation (%) |
6.2 |
6.6 |
7.7 |
6.3 |
7.1 |
7.9 |
6.9 |
7.0 |
7.4 |
6.7 |
|
Hardness (Kg/cm2) |
3.6 |
4.2 |
5.2 |
4 |
4.5 |
5 |
3.4 |
3.9 |
4.5 |
5.5 |
|
Thickness (mm) |
3.3 |
3 |
2.9 |
3 |
3.2 |
3.7 |
3.1 |
3.0 |
3.5 |
3.7 |
|
Friability % |
0.8 |
1 |
0.9 |
0.7 |
0.9 |
0.9 |
0.8 |
0.8 |
0.9 |
1 |
|
Disintegration time |
3min |
2min 52s |
3mis |
3min |
3min 10se |
3min 20s |
2min 40s |
2min 40s |
2min30s |
3min 40s |
Table 14. Post compressional paramaeters of Press coated tablets
|
Physical parameters |
P1F9 |
P2F9 |
P3F9 |
P4F9 |
P5F9 |
|
Weight variation (%) |
4.5 |
4.6 |
4.0 |
3.9 |
4.4 |
|
Hardness (Kg/cm2) |
7.2 |
6.8 |
7.0 |
6.9 |
7.1 |
|
Thickness (mm) |
5.0 |
4.8 |
4.5 |
4.7 |
4.8 |
|
Friability % |
0.8 |
0.9 |
0.9 |
0.7 |
0.9 |
From the above results it is eveident that the post compressional parameters are in acceptable limits.
In-vitro Release Studies
All the formulations were studied for 60 minutes, with time interval of 5 minutes. During this study among the 10 formulations F9 formulation showing fastest release (97%) with in 30 min. Based on the drug release F9 selected was optimized and further formulated for press coating.
Table 15. Dissolution studies of different formulations
|
Dissolution time (Min) |
Core formulation |
|||||||||
|
F1 |
F2 |
F3 |
F4 |
F5 |
F6 |
F7 |
F8 |
F9 |
F10 |
|
|
5 |
26 |
31 |
31 |
29 |
29 |
25 |
31 |
32 |
41 |
31 |
|
10 |
25 |
48 |
43 |
35 |
37 |
39 |
43 |
54 |
63 |
29 |
|
15 |
43 |
49 |
53 |
47 |
49 |
47 |
56 |
66 |
78 |
34 |
|
20 |
52 |
55 |
62 |
59 |
62 |
63 |
68 |
78 |
91 |
39 |
|
30 |
63 |
76 |
70 |
66 |
72 |
74 |
79 |
84 |
99 |
46 |
|
45 |
78 |
89 |
83 |
78 |
84 |
83 |
83 |
93 |
- |
50 |
|
60 |
89 |
92 |
93 |
86 |
91 |
96 |
102 |
98 |
- |
63 |

Figure 4. Dissolution study of f1, f2, f3

Figure 5. Formulations Dissolution f4, f5, f6

Figure 6. Formulations Dissolution f7, f8, f10

Figure 7. Formulations dissolution of f9
Based on the drug release with in the required time period F9 was optimizedand further formulated for press coating.
Table 16. Dissolution study of press coated tablets
|
Time in hrs |
Press coat Formulation code |
||||
|
P1F9 (%) |
P2F9 |
P3F9 |
P4F9 |
P5F9 |
|
|
1 |
6 |
6 |
3 |
3.8 |
2 |
|
2 |
11 |
8.2 |
9 |
7.7 |
5 |
|
3 |
14 |
10.6 |
21 |
31.1 |
10 |
|
4 |
18 |
13.7 |
39 |
39.6 |
14 |
|
5 |
23 |
34.6 |
60 |
52.3 |
20 |
|
6 |
36 |
48.8 |
79 |
71.6 |
32 |
|
7 |
48 |
88.3 |
87 |
89.4 |
47 |
|
8 |
75 |
99 |
92 |
95.2 |
59 |

Figure 8. Dissolution study of press coated tablets
From the above core formulations F9 was selected for press coat by using different polymers(HPMC and E.C) in different ratios (4:0, 3:1, 2:2, 1:3, 0:4) among which 3parts of HPMC and 1 part of E.C was optimized based on the lag time (11
% with in 4 hours) and percent of drug release and also further evaluated.
Stability Studies
Stability studies of the formulation F9 of press coated were carrried out to determine the effect of formulation additives on the stability of the drug and also to determine the physical stability of the formulation. The stability studies were carried out at 25ᴼ C/60%RH, 30 ºC/65% RH and 40 ºC/75% RH for 90 days. There was no significant change in the physical property and percent of drug release during 10 hour during the stability period.
Table 17. Stability studies of the formulation
|
Sampling interval
|
% of drug release at |
||
|
25°C/60%RH |
30°C /65% RH |
40°C /75% RH |
|
|
O day |
93 |
92.7 |
92.2 |
|
15 days |
94.5 |
94.45 |
94.40 |
|
45 days |
96.96 |
96.85 |
96.82 |
|
90 days |
96.5 |
96.42 |
96.38 |
Conclusion
The dosage forms can be classified based on the drug release like immediate release and controlled release dosage forms among them the controlled release dosage forms are gaining importance because of many advantages offered by it. There are many routes of drug delivery like oral route, parenteral route etc among them oral route has many advantages like patient compliance, dose precision etc. The lag time can be achieved precisely by using press coated tablets.Extensive literature survey has been performed to optimize, methods, mechanisms and benefits of the controlled release drugs.The various pre formulation studies like solubility; melting point of the drug has been performed in order to know the suitability of the drug for control release.The authencity of the drug was found out by performing FT IR studies and comparing to that of reference.The interaction studies were performed by FTIR, studies indicating there is no interaction between Etoricoxib, HPMC,E.C and other formulation excipients.The various pre compression parameters like angle of repose, bulk density, hausners ratio, compressibility index, porosity, and drug content were performed and all were shown satisfactory results.
Conflicts of Interests
All authors have none to declare
References
Anal AK. 2007. Time-Controlled Pulsatile Delivery Systems for Bioactive Compounds. Recent Patents on Drug Delivery & Formulation 1(1):73-9.
Arnett FC, Edworthy SM, Bloch DA, Mcshane DJ, Fries JF, Cooper NS et al 2005. American Rheumatism Association 1987 revised criteria for the causes of arthritis. Arthritis Rheum 31:315-324.
Arora S, Ali J, Ahuja A, Baboota S, Qureshi J. 2006. Review of pulsatile drug delivery systems: an approach for controlled drug delivery. Indian Journal of Pharmaceutical Sciences, 68:295-300.
Belgamwar V, Gaikwad M, Patil G, Surana S. 2008. Pulsatile drug delivery system. Asian Journal of Pharmaceutics 2-3:141-145.
Bussemer T, Otto I, Bodmeir R. 2001. Pulsatile drug delivery systems. Criteria Revise Therapeutic Drug Carrier System 18:433–458.
Deborah J, Cochrane B, Jarvis G, Keating. 2002. Adis new drug profile; etoricoxib. Drug 62: 2637.
Efentakis M, Koligliati S, Vlachou M. 2006. Design and evaluation of a dry coated drug delivery system with an impermeable cup, swellable top layer and pulsatile release. International Journal of Pharmaceutics 311:147-56.
Grobelny P, Gautam RD, Mukherjee A. 2012. Polymorphs and hydrates of Etoricoxib, a selective COX-2 inhibitor. CrystEngComm 14: 57-85.
Gupta AK. 1993. Introduction to pharmaceutics. CBS Publications, New Delhi.
Harris ED. 1997.Rheumatoid Arthritis. Philadelphia: WB Saunders
Jackson LS, Lee K. 1991. Microencapsulation and the food industry. Fett Aiss Technol 24: 289-297.
Jha N, Bapat S. 2004. Chronobiology and chronotherapeutics. Kathmandu University Medical Journal 2-8:384-88.
Lieberman HA, Lachman L, Schwartz JB. 1990. Pharmaceutical dosage forms: Tablets. Marcel Dekker, New York. p 201- 43.
Listair C Ross, Ross JM, Mathias W, Howard NES. 2000. Chronopharmaceutical drug delivery from a pulsatile capsule device on programmable erosion. Journal of Pharmacy and Pharmacology 52: 903-9.
Mohsin AA, Nimbalakr NE, Sanaullah S, Aejaz A. 2010. Formulation and evaluation of mouth dissolving tablets of amitryptyline hydrochloride by direct compression technique. International Journal of Pharmacy and Pharmaceutical Sciences 2(1): 204-10.
Prasannaraju Y, Asnutha G, Satyanandam S, Ramana Murthy KV. 2011. A study on physical charachterization of Hupu Gum, a anturalpollysachharide for pharmaceutical use. Journal of Innovative Trends in Pharmaceutical Sciences 2: 174 – 183.
Ravi KRJ, Veera JM, Mohamed STS, Madhu SCC. 2009. Review on: Pulsatile Drug Delivery Systems. Journal of Pharmaceutical Sciences and Research 1-4:109-115.
Reymond C Rowe, Paul J Sheskey, Marian Eequinn. 2009. Hand book of Pharmaceutical Exccepients,6th edition, E.C.
Sachin S, Neeraj K. 2007. Pulsatile Drug Delivery: Current Scenario. Current Research and Information on Pharmaceutical Science 8-2:27-33.
Sadaphal KP, Thakare VM, Gandhi BR, Tekade BW. 2011. Formulation and evaluation of pulsatile drug delivery system for chronobiological disorder: Asthma. International Journal of Drug Delivery 3:348-56.
Smolensky MH, Peppas NA. 2007. Chronobiology, drug delivery and chronotherapeutics. Advance Drug Delivery system Research 59:828-51.
Swati CJ, Monali SS, Ajay LB, Janardan NL, Aniruddha RC. 2010. Design and Evaluation of Enteric Press-Coated Tablet for Pulsatile Delivery of Atenolol. International Journal of Pharmaceutical World Research 1-15.


