Tanmay Chache1*, Seema R. Sapale2, Vikas Vaidya3, Deepal Ghadge1
1Ramnarain Ruia Autonomous College, L. N. Road, Matunga (East), Mumbai 400 019 Maharashtra, India
2Kirti M Doongursee College, Dadar, Mumbai 400028, Maharashtra, India
3Royal College of Arts, Science and Commerce, Mira Road (E), Dis- Thane 401107 Maharashtra, India
*Address for Corresponding Author
Tanmay Chache
Ramnarain Ruia Autonomous College,
L. N. Road, Matunga (East), Mumbai 400 019 Maharashtra, India
Abstract
Objective: A precise, accurate and reproducible GC-MS method is validated for simultaneous quantification of two bioactive markers in Lupeol and β-Sitosterol in the plant of Terminalia tomentosa and Eugenol and Kaempferol in the plant of Syzygium cumini. Materials and Methods: The mobile phase used was Helium gas. The column used was Rtx-1ms (100% dimethylpolysiloxane).The flow rate for developing the method in T. tomentosa plant was 1.5ml/min while in S. cumini was 0.9 ml/min. Results and Conclusion: Two precise methods were developed for Simultaneous Quantification of two different plants using Lupeol, β-Sitosterol in the extract T. tomentosa plant and Eugenol, Kaempferol in the extract of S. cumini plant. The method can be used for routine quality control of herbal raw materials as well as formulations containing any or all of these compounds.
Keywords: GC MS, Simultaneous quantification, T. tomentosa, S. cumini
Introduction
Detailed knowledge of various chemical processes occurring in plants and animals as well as in our environment has only been made possible through the power of modern instrumental analysis. Since its development in the mid-1950’s, gas chromatography-mass spectrometry (GC-MS) has become indispensable in the chemical analysts laboratory.
Gas chromatography in combination to mass spectrometry is an invaluable tool in the identification of molecules. It is an ideal technique for qualitative and quantitative determination of volatile and semi-volatile organic compounds in a wide variety of samples. A detection limit as low as sub-ng is possible (Sneddon et al., 2007).
Different parts of S. cumini are reported to have several medicinal properties like antidiabetic, antimicrobial, anti-inflammatory and free radical scavenging potential (Banerjee et al., 2005). Similarly many parts of T. tomentosa plant possess anti-diabetic, cardio protective, anti-inflammatory and anti-oxidant properties (Budholiya et al., 2019). The present work is carried on Simultaneously quantitate two different phytoconstituents Lupeol, β-Sitosterol in the extract T. tomentosa plant and Eugenol, Kaempferol in the extract of S. cumini plant (Sarju et al., 2012).
Materials and Methods
Chemical
HPLC grade methanol, ethanol, toluene, n-hexane, ACN were procured from E.Merck, Mumbai, India. Reference standards Lupeol (Puriety >95%) and β-Sitosterol (Puriety >95%) were purchased from Sigma-Aldrich Chemie (Aldrich Division; Steinheim, Germany). The reference standards Eugenol and kaempferol were purchased from Sigma-Aldrich (Bengaluru).
Plant Material
T. tomentosa fresh plant was collected from the field area of Kankeshwar, Alibaug, District- Raigad, Mharashtra, India in the month of November, and the speciemens were auntheticated by Dr. Ganesh Iyer (Taxonomist), Department of Life Science, Ramnarain Ruia College, Matunga, Mumbai. . The plant material was shade dried for five days and was kept thereafter in hot air oven maintained at 45 ± 5°C for fifteen days.
Plant of S. cumini was collected in Mumbai. Herbarium samples of S. cumini were prepared in duplicate and authenticated by Botanical Survey of India (BSI), Pune, India. The plant were washed with water to remove any dust particles, dried in shade, powdered and then sieved through BSS mesh size 85 and stored at 25°C in an airtight container.
Preparation of Stock solutions
Stock solutions of standards were prepared in methanol immediately before use. 10 mg each of Lupeol and β-Sitosterol and Eugenol and Kaempferol were dissolved in 10 ml of methanol to make a concentration of 1000μg/ml. All the standards were further diluted using methanol to make a solution of appropriate concentrations.
Sample Preparation
For T. tomentosa, 200 ml of liquid sample was taken in a measuring cylinder and transferred in a round bottom flask. It was mixed well with 100ml of ethanol. It was then transferred to separating funnel. 25ml of n-hexane was used at a time for extraction. No. of extractions were four.
For S. cumini, the powdered material of Syzygium cumini was being carried out by Soxhlet extraction. Five grams of plant powder was weighed and packed in soxhlet with Whatman paper thimble. It was then extracted with 100 ml methanol for 12 hours using Soxhlet extractor. Extracts were filtered through a syringe filter of pore size 0.45 µm (Merck, India) before further analysis.
Chromatographic Conditions
Gas Chromatography mass spectroscopy was performed on GC-MS QP 2010 Ultra Shimadzu instrument.
For T. tomentosa, stationary phase was Rtx-1ms (100% dimethylpolysiloxane) with Helium as the carrier gas and flow rate was 1.5ml/min. The interphase temperature was 280°C while the ion source temperature was 200°C. The sample volume injected was 1µl. The scan speed was 1111.
For S. cumini, stationary phase was Rtx-1ms (100% dimethylpolysiloxane) with Helium as the carrier gas and flow rate was 0.9 ml/min. The interphase temperature was 280°C while the ion source temperature was 250°C. The sample volume injected was 1µl. The scan speed was 909.
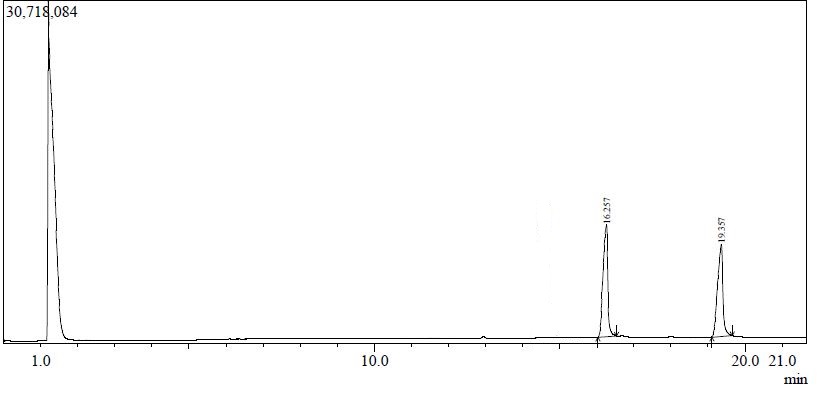
Figure 1. Chromatogram of Pure Standards Peak 1, Eugenol; Peak 2, Kaempferol
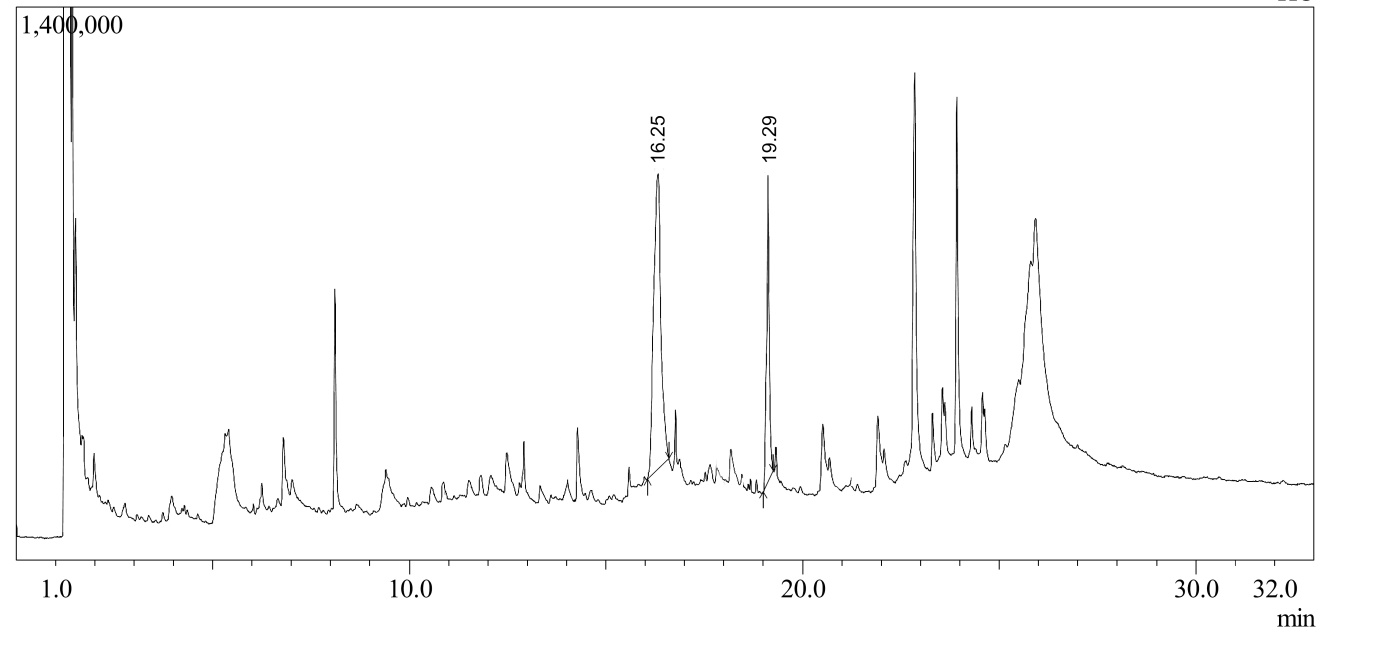
Figure 2. Chromatogram of S. cumini plant extract; Peak 1, Eugenol; Peak 2, Kaempferol
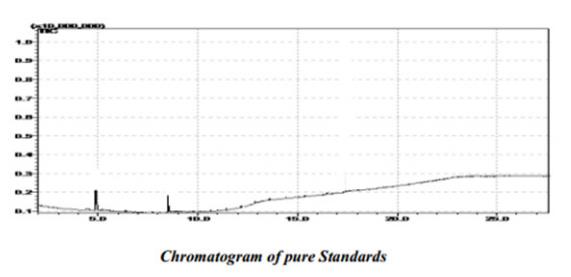
Figure 3. Chromatogram of Pure Standards; Peak 1, Lupeol; Peak 2, β-Sitosterol

Figure 4. Chromatogram of T. tomentosa plant extract; Peak 1, Lupeol; Peak 2, β-Sitosterol
Validation of the method
ICH harmonized tripartite guidelines were followed for the validation of the developed analytical method. The objective of validation of an analytical procedure is to demonstrate that it is suitable for its intended purpose. Results from method validation can be used to judge the quality, reliability and consistency of analytical results; it is an integral part of any good analytical practice.
System Suitability
System suitability tests for the analysis are used to verify the adequate reproducibility of the equipment. The suitability test was carried out to determine the performance of the operating system. The system suitability experiment in S. cumini was carried out by injecting 1.0 μg/ml of Eugenol and Kaempferol. The solution was injected six times under the optimized chromatographic conditions. While for the method on T. tomentosa, system suitability experiment was carried out by spotting 50.0 µg/mL of Lupeol and 10µg/mL of β-Sitosterol respectively.
The solution was spotted six times each on the chromatographic plate under the optimized chromatographic conditions.
Precision
The variability of the method was studied by carrying out repeatability, inter-day and intra-day precision. Repeatability was carried out in same laboratory, on same day as well as on two consecutive days, by analysing standard solutions of Eugenol, Kaempferol, Lupeol and β-Sitosterol using optimized chromatographic conditions.
Linearity
Linearity of a method is the measure of how well a calibration plot of detector response against concentration approximates to a straight line. The concentration range of 0.5 μg/mL to 125.0μg/mL was selected for both the methods for linearity.
Limit of Detection and Limit of Quantification
ICH defines the limit of detection (LOD) is the lowest concentration of an analyte that can be detected under the operational conditions of the method but not necessarily quantitated as an exact value. The limit of quantification (LOQ) is defined as the lowest concentration of an analyte in a sample that can be determined with acceptable precision and accuracy, under the operational conditions of the method.
Assay
One µl of sample solution of plant of T. tomentosa and S. cumini were injected. Also different concentrations of Eugenol, Kaempferol, Lupeol and β-Sitosterol were injected under optimized chromatographic conditions separately. The peak corresponding to of Eugenol, Kaempferol, Lupeol and β-Sitosterol in the sample solution was identified by comparing the Retention time values of the sample, with that of standards separately. The amount of Eugenol, Kaempferol, Lupeol and β-Sitosterol present in sample solution was determined from the calibration curve by using the peak area of standards generated by the chromatogram.
Recovery
The recovery experiment was carried out to check if there is any interference of other constituents with the peaks of Eugenol, Kaempferol, Lupeol and β-Sitosterol present in extract of S. cumini and T. tomentosa respectively. Accuracy of the method was established by carrying out recovery experiment at three different levels, using standard addition method. Each sample was analyzed in seven replicates and the amounts of Eugenol, Kaempferol, Lupeol and β-Sitosterol recovered for each level, were determined separately. The value of percentage recovery for the three components was then calculated.
Ruggedness
Proposed method was not influenced by the factors considered for ruggedness study. Change in flow rate and mobile phase composition affected the retention time of the three analytes but the results were satisfactory since % RSD was <2% for both the methods.
Results and discussion
Two precise, accurate and reproducible GC MS methods are validated for simultaneous quantification of two bioactive markers. The methods were validated for specificity, linearity, LOD, LOQ, intra- day and inter-day precision, recovery, ruggedness and stock solution stability. The methods were found to be linear from 0.5µg/mL to 125µg/mL for both the methods respectively. The correlation coefficient was found to be ≥0.999 for all the three components. The relative standard deviation for inter-day and intra-day precision was <2%. This indicates the method is precise. The recovery values of the standards were within acceptable limits (85.0 to 115.0%). The assay value for samples of S. cumini plant powder was found to be 0.13% and 0.11% for Eugenol and Kaempferol. The assay value for samples of T. tomentosa extract was found to be 0.33% and 1.07 % for Lupeol and β-Sitosterol respectively. The method is specific for all the components because it resolved all standards well in the presence of other phytochemicals in S. cumini and T. tomentosa.
Conflict of interest
The authors whose names are listed certify that they have NO affiliations with or involvement in any organization or entity with any financial interest, or non-financial interest (such as personal or professional relationships, affiliations, knowledge or beliefs) in the subject matter or materials discussed in this manuscript.
References
Alladi S, Prakash SD, Nalini M., 2012. Antihyperglycemic activity of the leaves of Terminaliatomentosa against normal andalloxan induced diabetes rats. Research Journal of Pharmacy and Technology; 5:1577.
Banerjee A, Dasgupta N, Bratati, 2005. In vitro study of antioxidant activity of Syzygium cumini fruit. Food Chemistry 90:727-733.
Budholiya P, Sharma HK. 2019. Comparative Phytochemical Screening and estimation of Bioactive constituents of leaves Lagerstroemia parviflora, Gardenia latifolia and Terminalia tomentosa. Journal of Drug Delivery and Therapeutics, 2019:674-678.
Indian Council of Medical Research; Vol.1. New Delhi: 2003. Anonymous. Quality Standards of Indian Medicinal Plants; pp. 261–70.
Kirtikar R, Basu BD. Indian Medicinal Plants. Vol. 2. Allabahad: Lalit Mohen Basu; 1975. pp. 1180–1184.
Mehta BK. 2012. Gas Chromatography Mass Spectrometry (GC-MS) analysis of the hexane extract of the Syzygium cumini bark. Journal of Medicinal Plants Research, 6:25.
Myint S, Daud WR, Mohamad AB, Kadhum AA. 1996. Gas Chromatographic determination of eugenol in ethanol extract of cloves. Journal of Chromatography B: Biomedical applications, 679(1-2):193-5.
Nguyen HP, Kimaru IW. 2014. GC-MS Analysis of herbal medicinal remedy to identify potential toxic compounds. LC-GC Chromatography Online, 12(4).
Sarju N, Samad AA, Ghani MA, Ahmad F. 2012. Detection and Quantification of Naringenin and Kaempferol in Melastoma decemfidum Extracts by GC–FID and GC–MS. Acta Chromatographica, 24(2): 221–228.
Shinde SL, More SM, Junne SB, Wadje SS. 2011. The antifungal activity of five Terminalia species checked by paper disc. International Journal of Pharmaceutical Research and Development, 3:36-40.
Sneddon J, Masuram S, Richert JC. 2007. Gas Chromatography‐Mass Spectrometry‐Basic Principles, Instrumentation and Selected Applications for Detection of Organic Compounds. Analytical Letters, 40(6):1003–12.
Srivastava SK, Srivastava SD, Chouksey BK. 1999. New constituents of Terminalia alata. Fitoterapia 70 (1999): 390-394.


